Version 5.19
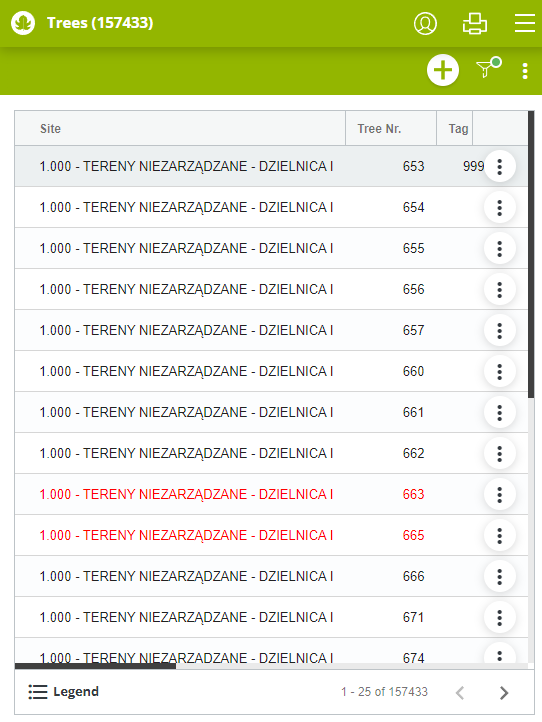
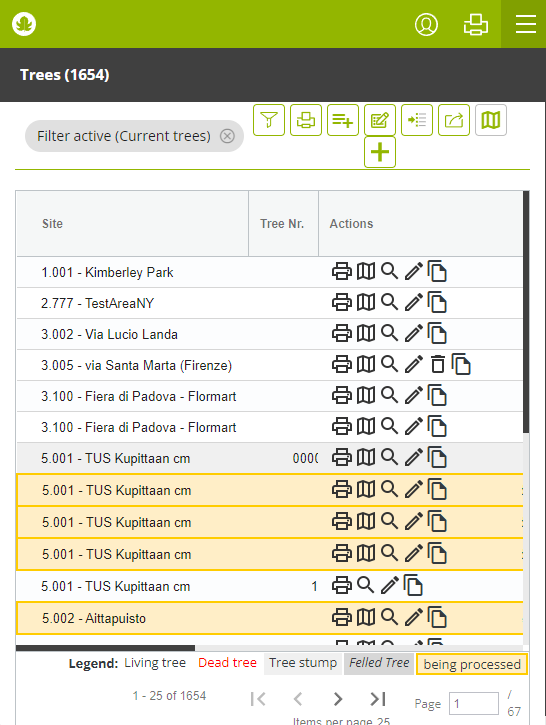
The Web application's interface has been revised to make GreenSpaces easier to use on tablets and smartphones. In particular, the display of the lists has been improved: the upper part of the window, containing the total number of objects in that menu, the action buttons, the filter view, the button cluster that allows you to act on the data at the end of each line, and the lower part of the screen where a popup for the legend has been created. All these changes in the user interface are especially noticeable on small screens.
|
|
|
Fig 1.1: New and cleaner interface
|
Fig 1.2: Previous interface
|
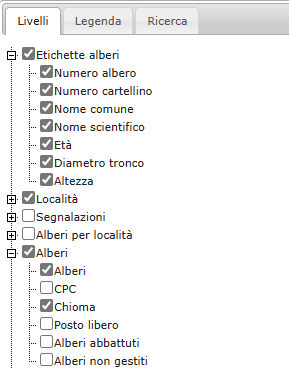
With this version it is possible to display certain tree attributes as labels on the map. The new map layer "Tree labels" allows the height, trunk diameter and age of the tree to be displayed on the map. The "Common Name" and "Scientific Name", which are now separate, the "Tree Number" and the "Tag Number" have also been added to the same layer group.
|
|
Fig 2.1: The new “Tree Labels” layer
|
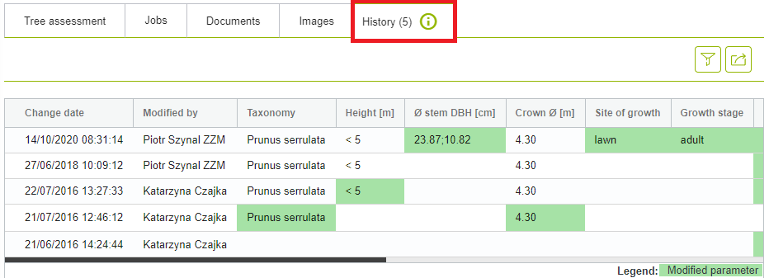
A new “History” tab has been created in the tree form to show changes to certain plant parameters (taxonomy, height, trunk diameter, crown diameter, physiological phase, position). Each time one of these parameters is changed, a row is added to the history table showing the modified value, who edited it and when. In this section the changes made to the tracked parameters in the tree form over time are shown (which GreenSpaces previously tracked but did not display) and, from this update onwards, every single change is displayed in the list, including those relating to the variation in the state of the plant, previously contained in the "Change history" tab. All data can be filtered and exported.
|
| Fig 3.1: The new “History” tab in which changes made are listed |
The monitoring printouts provide an overview of the situation concerning sites, trees and jobs. Until now, the printout represented the situation at the time of the request. From now on it will be easier to check what the situation was on a certain date.
From the list of sites it is in fact possible to filter by the new field "Active on date" and the statistics printout will only show those that were present that day.
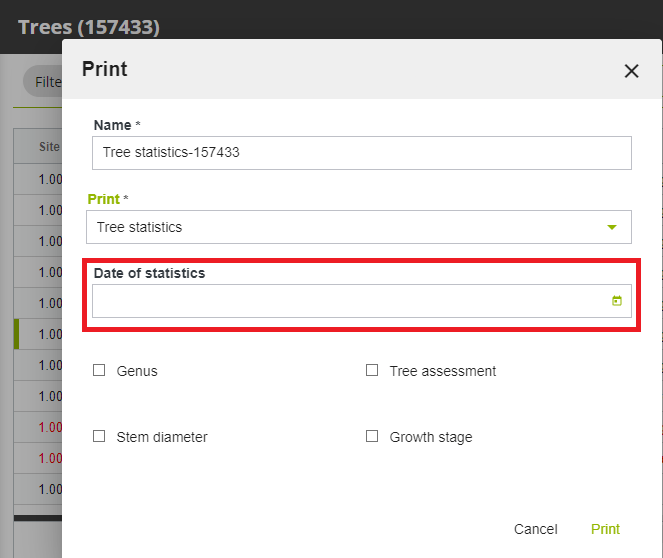
Alternatively, when printing the tree statistics, the dialogue box now presents the possibility of entering the date to which the statistics should refer (see Fig. 4.1)
While from the planned jobs menu, the statistics printout now takes into account the filter set on the dates (period filter). In addition, the job monitoring printout has now been extended to include not only jobs on trees, but jobs in all categories.
|
|
Fig 4.1 The new filter in the print dialog box.
|
As part of the Interreg IT-CH VerdeVale project, indices were developed to calculate the environmental value of green areas. These indices are now available to all customers who activate the BENEFITS Module.
In the site form, the new tab "Environmental value" shows the following indices:
-
Average infiltration capacity (calculated from the average infiltration capacity of the different ground covers in the area. A complete census of all elements in an area is required to display this information);
-
Simpson index for tree diversity;
-
Arboreal average size index;
-
Arboreal environmental value.
The calculation of ecosystem services for trees and shrubs has been improved and is now available in some new aggregated lists for easier interpretation.
The environmental benefits of trees and shrubs are calculated daily on the basis of plant parameters and meteorological data, and are visible in the appropriate lists.
New lists have been created to facilitate the interpretation of annual data. For the current year, the annual value shown is the cumulative value up to the day of display and increases daily until the year is completed.
The ecosystem services of the plants of an entire site are summed up on an annual basis and can be viewed in the "Ecosystem Services" tab in the "Site" form.
For the ecosystem services of CO2 storage, CO2 absorption, PM10 removal, and energy saving, an economic value calculation on an annual basis has been added. The unit prices to be applied to each ecosystem service are distinct from year to year, and are configurable by the administrator user. The initial values are entered by R3GIS using official sources (average cost of a tonne of CO2 calculated for each country as calculated by the World Bank, the average price of electricity and the unit social cost of PM10 as reported in the European Ecosense database). If on the 1st of January of the new year no unit price has been entered by the user, the prices of the previous year are automatically copied. If a unit price is changed, the recalculation of the economic value occurs directly when saving the configuration.
With this version we have implemented a new Open Data weather source. Weather data are displayed in the weather dashboard and in the hourly weather data list. In addition, forecasts for the following 72 hours are included and daily statistical values are calculated.
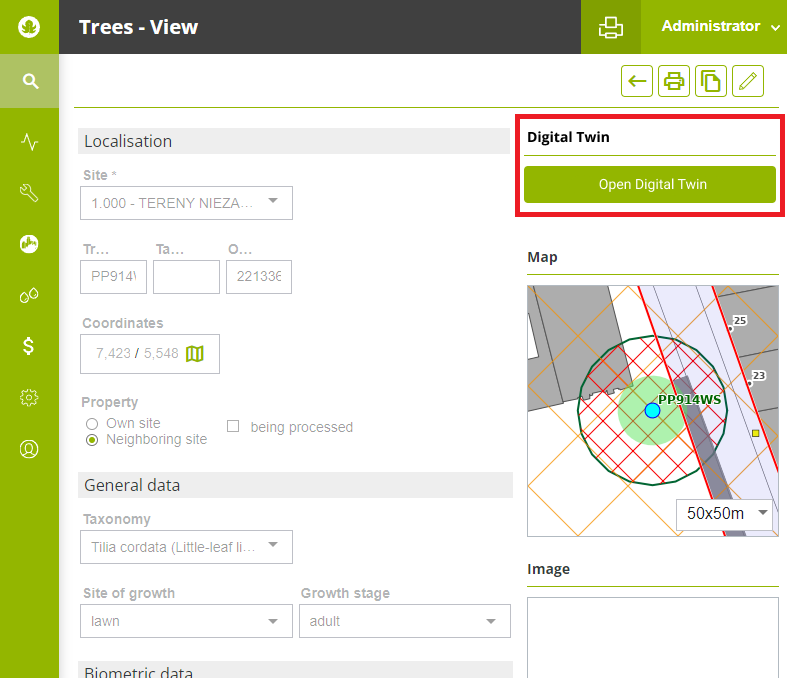
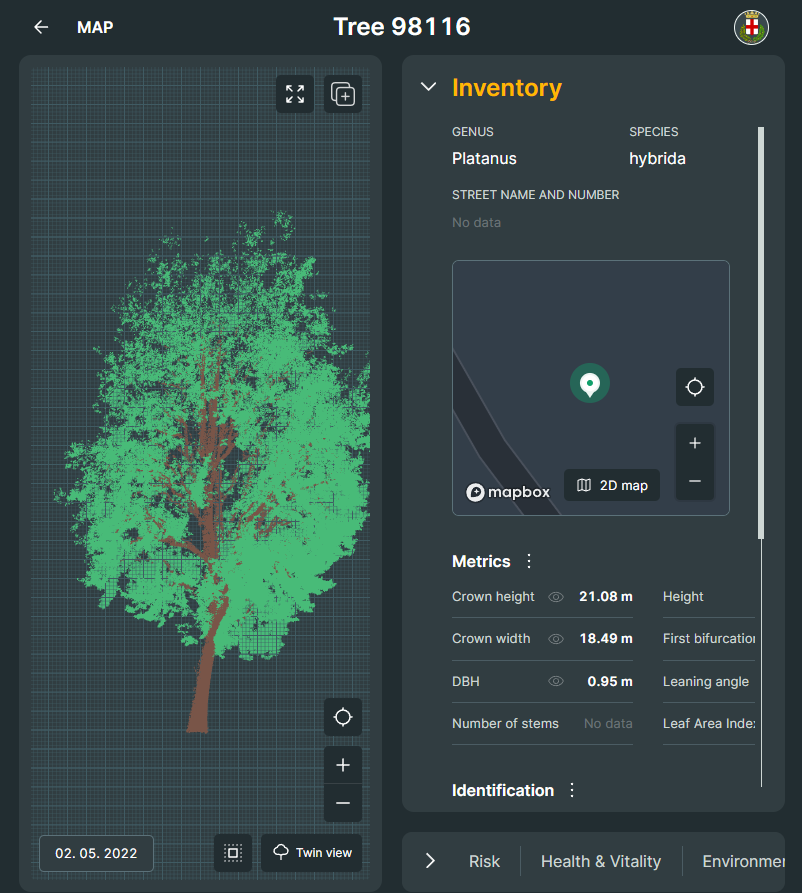
For our customers who have subscribed to a periodic digital tree twin survey with greehill (www.r3gis.com/greehill) for the Smart Tree Inventory, it is now possible to switch from the "Tree" tab in GreenSpaces to the digital tree twin representation on the greehill platform with the simple click of a button.
|
|
|
| Fig 5.1: "Tree" tab with connection button |
Fig 5.2: Recalled greehill digital twin board |
A monitoring issue (MON) can be attached to an object and the resulting job inherits its position. For point objects it is the point coordinates, for areas it is the midpoint of the area and for linear objects it is the midpoint of the line.
This works well for objects in the inventory, such as individual trees.
In the case of issues on objects that are not present in the inventory, the position of the issue was previously lost when the job was created, as it was not linked to any surveyed items.
Thanks to new developments in this release, it is now possible to include the position of the issue with the following two options:
-
If the issue is not linked to any object, its position is automatically used for the resulting job.
-
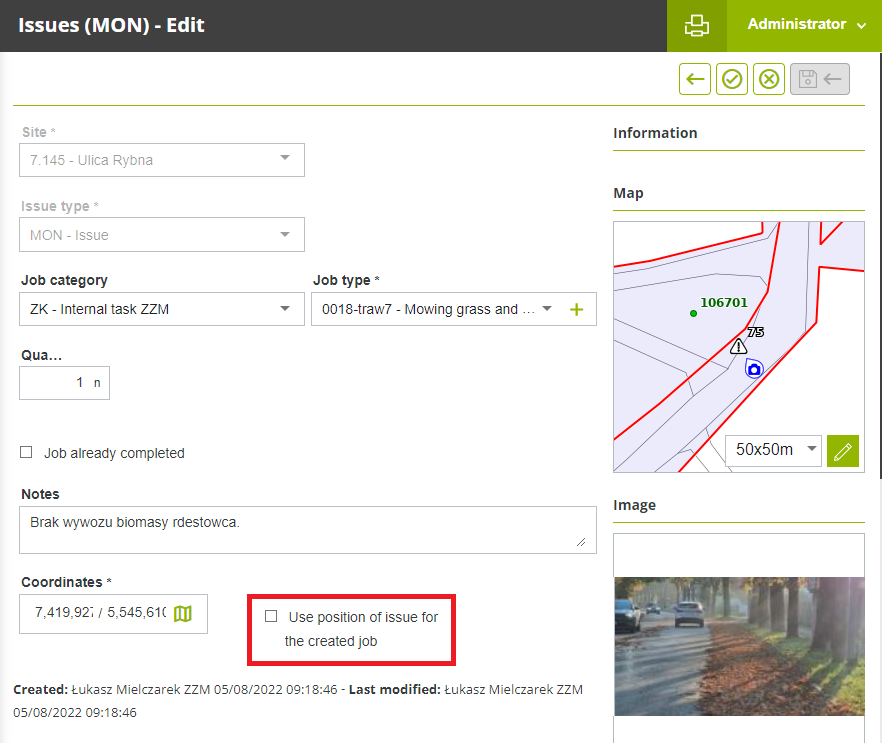
If the issue is attached to an object, the position of the object is transferred to the job by default, but you can activate an optional flag to still use the position of the issue instead of the position of the object (e.g. when you want to indicate the presence of a hole in a large lawn).
|
|
|
Fig 6.1 The check box that allows the geographical position of the reporting instead of using the position of the selected object
|
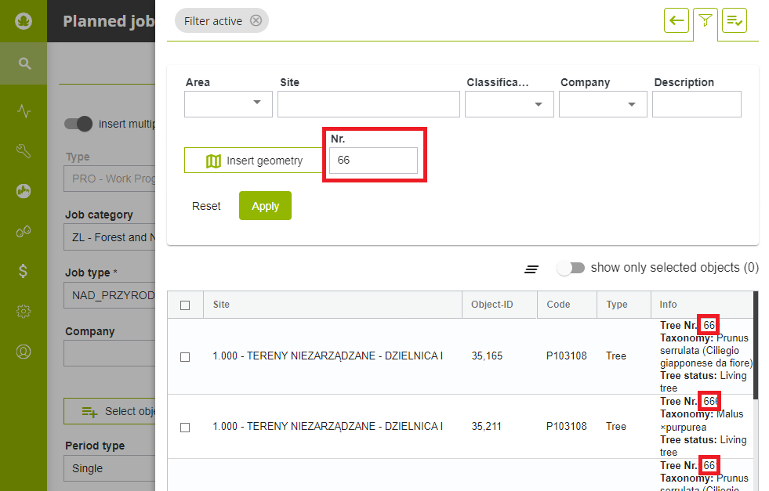
To solve the difficulty of selecting specific objects for a certain type of job, a new search filter for "Object Number" (pt, Nr.) has been implemented. This filter is available in the object selection phase for a multiple job. In order to be able to use this new field correctly, we recommend that you first fill in/edit the pt/Nr parameter of the objects on which you want to plan the job, e.g. by adding a letter as an indication of maintenance category (e.g. 1A, 2A, 3B, 4B, 5C, etc.) and then filter the objects to be selected for the multiple job by setting the "Nr." field in the filter with the appropriate letter.
|
|
|
Fig 7.1 Using the "Nr" filter, it is possible to select specific objects for a certain type of work.
|
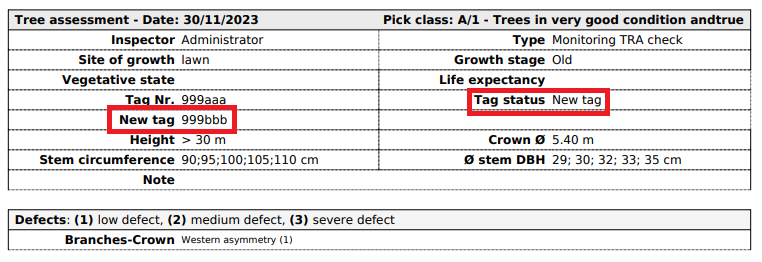
If a tag change is detected during a tree assessment, the form that is printed now indicates the change and contains both the old and the new tag number.
|
|
|
Fig 8.1 Print with evidence of tag change
|
Risk assessment based on the Areté method was already introduced with the last update to version 5.18 and was activated for some pilot customers. During the deployment, some discrepancies emerged between the Areté protocol (specifically the Excel ARETE_OPEN.xlsx) and the calculation algorithms developed in GreenSpaces. The difference concerned, specifically, the parameters for the classes of moving targets (traffic, pedestrians/cyclists), which have now been corrected and are now calculated dynamically, as it happens in the Areté method. With the latest refinements, it is now possible to activate the risk assessment all installations. However, activation remains on request. If you are interested, please send an email to R3GIS.
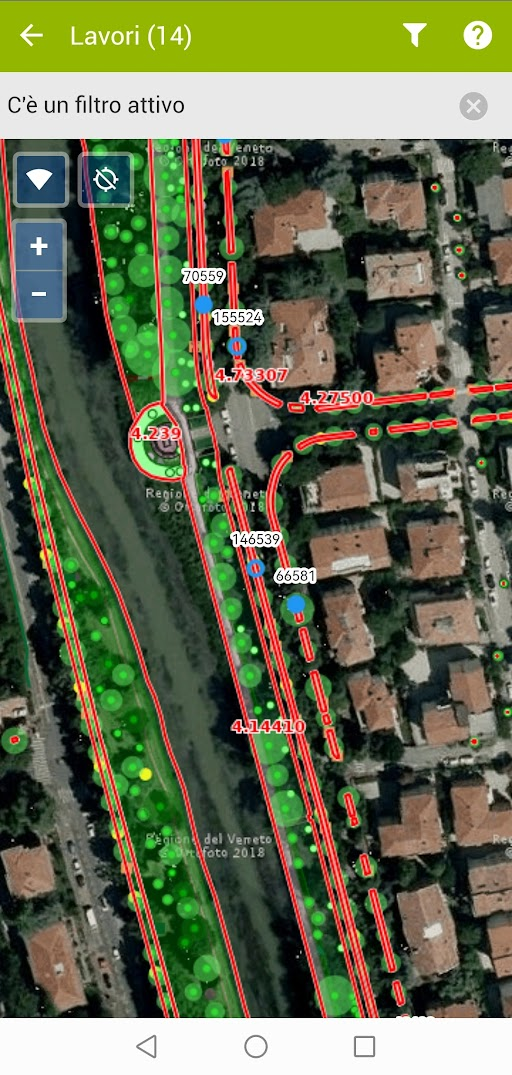
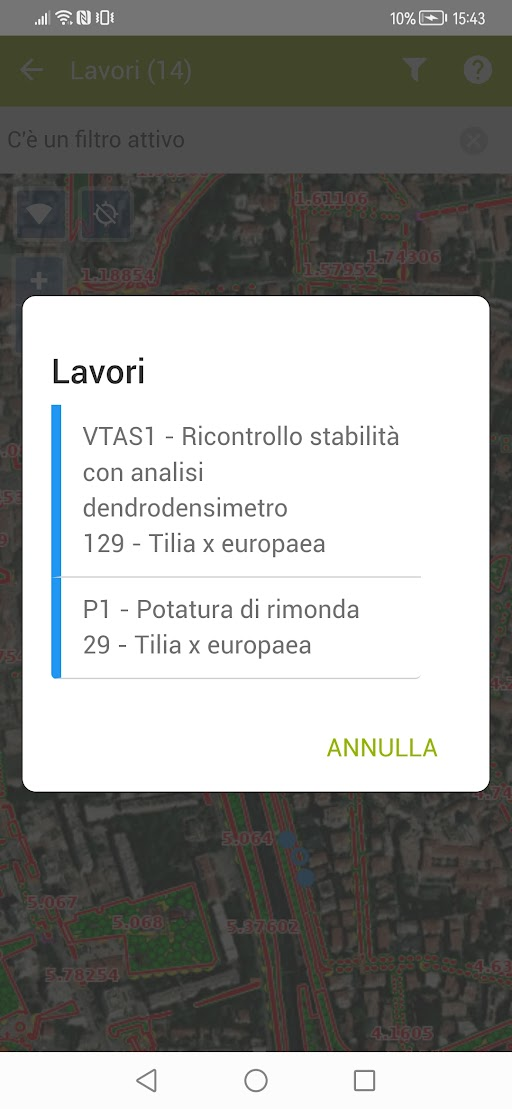
The new version of GreenSpaces Mobile makes it easier to view/edit jobs directly from the map: if there is only one job, clicking on the map opens the form directly, while if there are several jobs overlapping geographically, a list opens allowing the user to choose which of the jobs to view.
|
|
|
|
Fig 9.1 Jobs on mobile map
|
Fig. 9.1 Job selection list
|
Upon request, it is now possible to integrate your own IAM (Identity and Access Management) based on OpenID Connect (OIDC) standards with GreenSpaces user management. This will make it possible, for example, to log into GreenSpaces with the credentials issued by the portal of your municipality/authority. The integration module is optional and is available at additional cost.
-
Alignment of advanced filters between "Trees" and "Planned Jobs" list;
-
Object selection for multiple jobs by entering geometry;
-
Management of the selection of more than 3,000 objects (1,000 in the previous version) in job planning;
-
Checking the validity of the job type which can be planned for the selected object;
-
Improved job list print header;
-
It is no longer possible to schedule tree assessments on stumps and felled trees;
-
Archived equipment is no longer proposed in the list of equipment to be inspected;
-
Mobile app behaviour related to the filters when trying to display more than 500 jobs in the mobile.